Ground Air Medical qUality Transport (GAMUT) Quality Improvement Collaborative is a data analytics platform for medical transport programs to track, report, and evaluate their performance on transport-specific quality metrics.
EYEMG helped the GAMUT team to define, specify and build the interactive tools for the Web. GAMUT members enter their data through online forms using the same metrics, and that data is analyzed and presented through interactive charts and visuals.
Specification, Hosting/Colocation, Mobile App Development, Web Development, Web Design
Website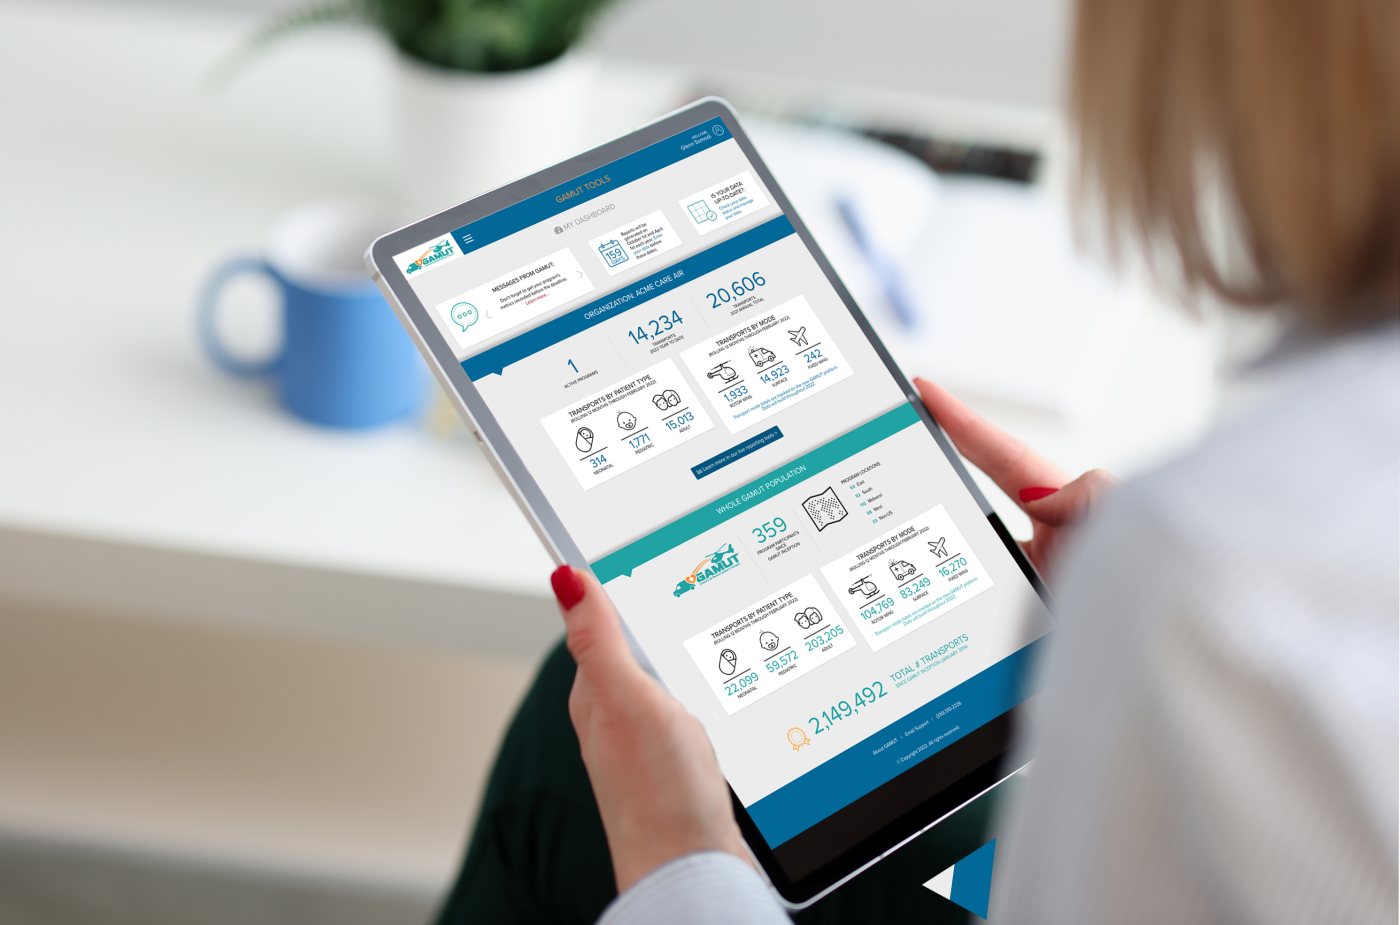
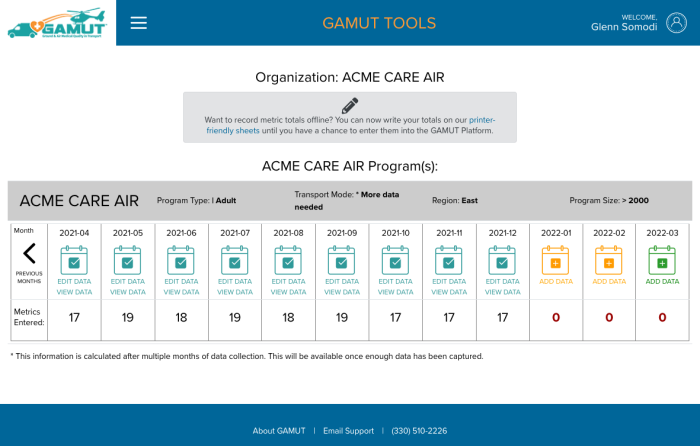
Members log into the GAMUT Data Analytics Platform, where they see their programs quality statistics as compared to the GAMUT population of all other programs. An organization with multiple programs would see all of their programs metrics separated on this page.
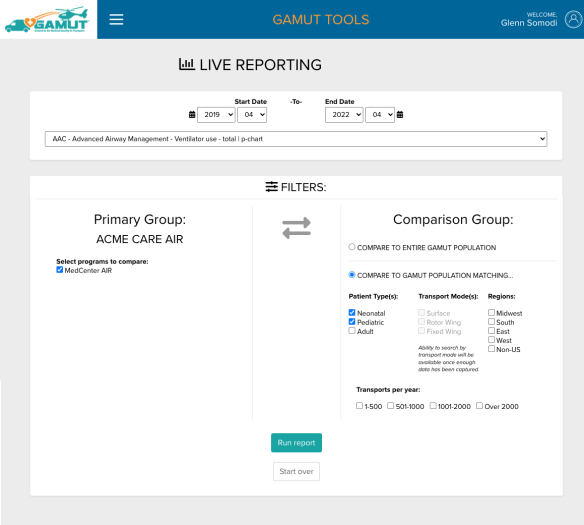
A live reporting tool allows the program to compare any metric against the GAMUT population. Additionally, a program can compare itself by patient type, by transport mode and by region. It can compare against the whole GAMUT population, or their own programs individually.
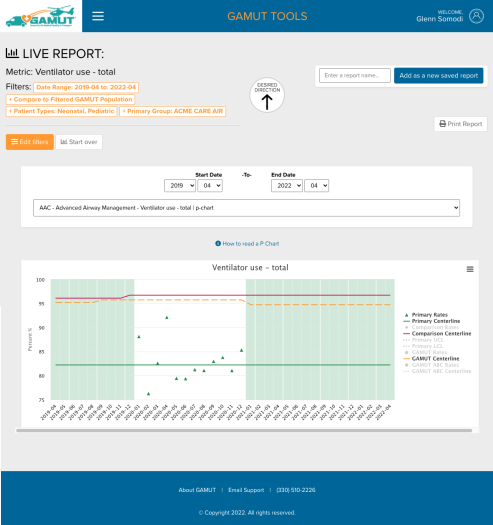
Results from live reporting are graphed, with the graph type changing based on the metric being viewed.
Metric data is entered each month by GAMUT members. This data is pooled with other members to get an industry-wide view of quality measurements.
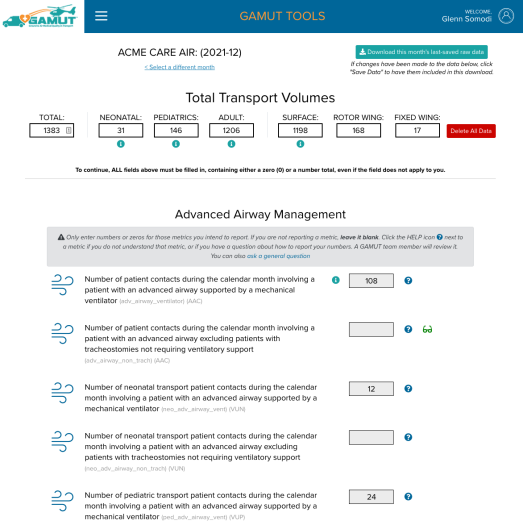
GAMUT data is entered for each of the metrics collected for the member's pre-determined patient types (pediatric, adult and/or newborn).
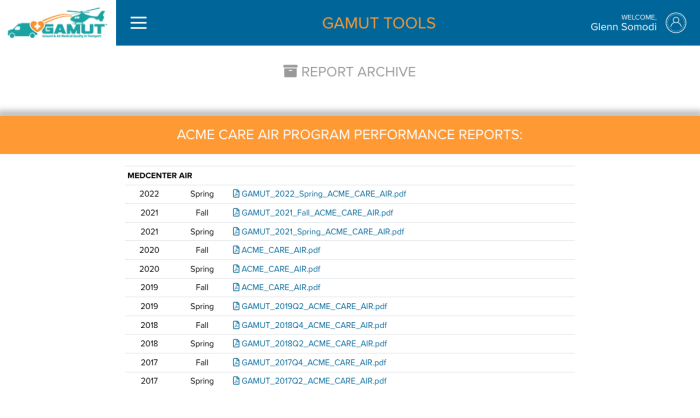
All metrics and graphs for each metric are generated in biannual reports (PDF format) and stored in a report archive for historical data viewing.
The GAMUT Platform has these features: